

TikTok 3.8% and More: 2026 Social Metrics That Drive Ecommerce Revenue

Track attributed revenue and ROAS by platform, conversion rate from social sessions, click through rate to the product page, and add to cart or checkout initiation rate first. Everything else, including likes, follower counts, and impressions, is a diagnostic tool at best. Measure these five with disciplined UTM tagging and treat Shopify or GA4, not the platform dashboard, as the final word on what actually sold.
TL;DR:
- Focus on revenue-mapped metrics like attributed sales, conversion rates, click-through, add-to-cart, and ROAS, rather than vanity metrics like likes or followers.
- Different platforms have distinct engagement signals: TikTok favors video completion and shares, while Pinterest emphasizes saves and outbound clicks, affecting conversion quality.
- Ensure UTM tags are standardized and rely on Shopify or GA4 data as the ground truth, not platform dashboards, to accurately measure actual sales contribution.
- Implement regular audits of attribution setup and consider automation tools to improve tracking consistency and free up time for performance analysis.
- Build a two-tiered dashboard with daily revenue and ROI metrics for quick assessment, and diagnostic metrics for troubleshooting when figures deviate from targets.
Table of Contents
- Social Media Metrics Ecommerce Teams Should Actually Track
- Which Platform Converts Best for Your Product Type
- How to Make Your Attribution Data Trustworthy
- Build a Dashboard You’ll Actually Look At
- Setting Realistic Targets With 2026 Benchmarks
- Reading Your Metrics Against the Funnel, Not in Isolation
- What Social Metrics Reveal About Repeat Customers
- Connecting Social Data to Your Broader Analytics Stack
- The Data Quality Problems That Quietly Wreck Your Reports
- What Automation Actually Fixes in Your Measurement Setup
- Automate the Content, Keep the Data Clean
- Sources
Social Media Metrics Ecommerce Teams Should Actually Track
Most ecommerce dashboards are cluttered with numbers that feel productive but don’t move revenue. Likes feel good. They don’t buy anything.
There’s a real split in social analytics between vanity metrics and what you might call actionable metrics, or more precisely, revenue-mapped metrics. Vanity metrics (followers, likes, impressions) tell you about visibility and momentum. They’re not worthless, but they’re indirect. Revenue-mapped metrics tell you what actually happened to a dollar after someone saw your post: did they click, did they add to cart, did they check out, did they come back next month.
The standard industry term for this distinction is between top-of-funnel awareness metrics and bottom-of-funnel conversion metrics, and the mistake most store owners make is reporting only the top half because it’s easier to pull from a platform’s native dashboard.
Here’s the shortlist that actually maps to revenue:
- Attributed revenue / revenue by social source. This is the dollar amount your analytics platform (Shopify or GA4) attributes to a social channel, based on UTM parameters or a platform pixel. It’s the closest thing to ground truth you have, and it’s the number that should anchor every report.
- Conversion rate from social traffic. Calculated as purchases divided by social sessions. If 1,000 people land on your site from Instagram and 20 buy, that’s a 2% conversion rate. This tells you whether the traffic you’re generating is qualified or just curious.
- Click-through rate (CTR) from post or ad to product page. This measures how compelling your content and call-to-action actually are. Static image posts on Instagram often see CTRs in the low single digits, while short-form video with a strong hook can push higher, especially when the offer is clear in the first three seconds.
- Add-to-cart and initiate-checkout rates. These sit between click and purchase and tell you exactly where shoppers stall. A high CTR paired with a low add-to-cart rate usually means your product page, not your content, has a problem.
- CPA (cost per purchase) and ROAS. These are your efficiency metrics, but they come with a caveat: platform-reported ROAS and store-measured ROAS routinely disagree, sometimes by 20% or more, because of how each system attributes credit for a sale.
Attributed revenue deserves top billing because it’s the only metric on this list that directly answers the question a store owner actually cares about: did this channel make me money. Everything else is either an input to that number or a way to diagnose why it’s low.
Pro Tip: *Pull your platform’s ROAS and your Shopify-attributed revenue for the same campaign side by side once a week.
Which Platform Converts Best for Your Product Type
Platform algorithms reward different behaviors, and those behaviors predict conversion in different ways. Treating every platform’s engagement signal as an interchangeable proxy for purchase intent is one of the most common measurement mistakes in social commerce.
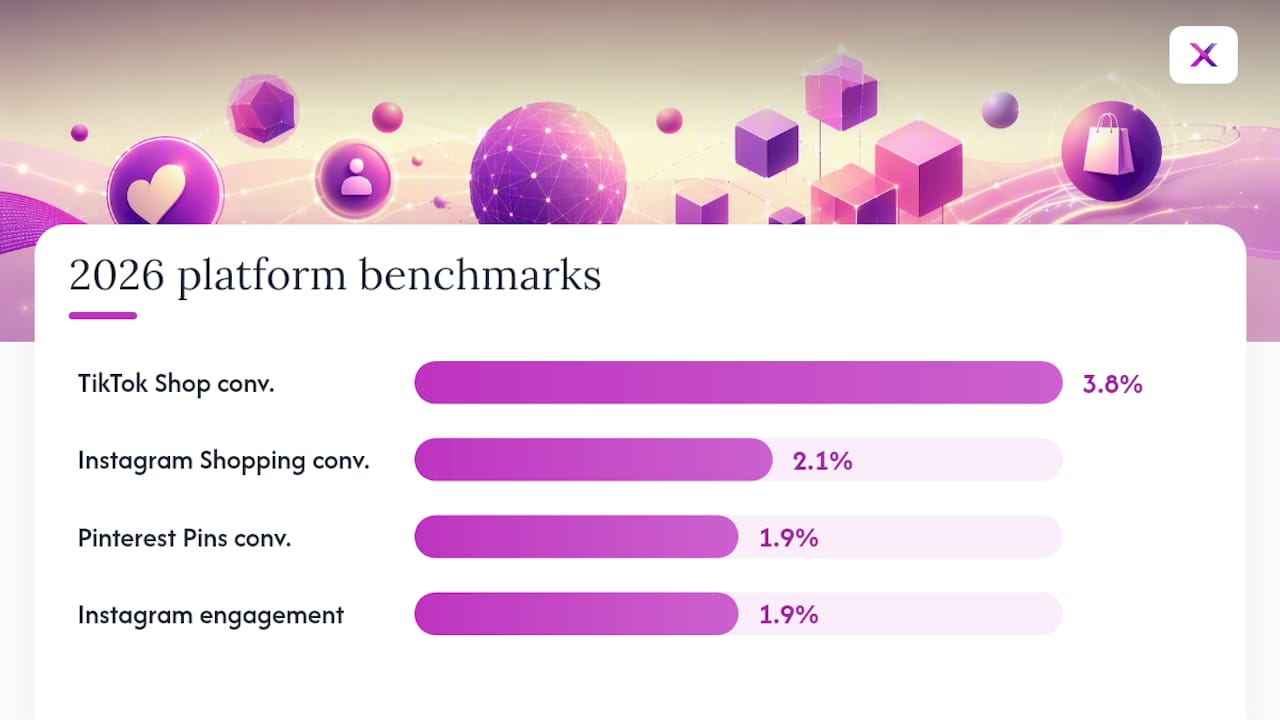
- TikTok rewards video completion rate, shares, and saves. It’s a discovery engine, and it performs especially well for impulse purchases and lower-AOV products (think $15 to $40 items) where a viewer can go from curiosity to purchase in one sitting. TikTok Shop conversion rates are among the highest for social commerce platforms in recent mid-market DTC data, the highest of any major platform tracked.
- Instagram leans on saves, profile visits, and product page clicks, with Instagram Checkout adding a native conversion path for brands in visual, higher-consideration categories like apparel, beauty, and home goods. Instagram Shopping converts at closer to 2.1% in the same dataset, still strong but reflecting a longer decision path than TikTok’s impulse-driven traffic.
- Pinterest users behave more like researchers than browsers. Saves and outbound click rate matter more here than likes ever will, and the platform tends to convert well for considered purchases, furniture, wedding goods, home renovation products, where someone might save an idea for weeks before buying.
- YouTube rewards watch time and clicks on product shelves. It’s the strongest platform for demonstration-heavy products: tools, skincare routines, anything that benefits from someone watching it work before they buy.
A useful mental model here, borrowed from how platform algorithms actually function: TikTok favors completion and share signals, while Pinterest favors saves and outbound clicks, so a “good” engagement number on one platform can mean something entirely different on another. Don’t compare a TikTok completion rate to an Instagram save rate and expect them to tell you the same story.
One more wrinkle worth knowing: native checkout changes the attribution picture entirely. Early 2026 merchant data shows orders fulfilled through TikTok’s own logistics program have higher repeat purchase rates than merchant-fulfilled TikTok orders, which suggests fulfillment speed and checkout friction affect not just whether someone buys once, but whether they come back. That’s a metric most dashboards never surface. If you sell through Shopify’s Instagram integration, you’ll want to track native checkout conversions separately from click-through-to-site conversions, because they behave differently and often get attributed differently too.

How to Make Your Attribution Data Trustworthy
Most social metrics fall apart under scrutiny because the tracking setup underneath them is sloppy. Fix the plumbing before you trust the dashboard.
-
Standardize your UTM parameters. Use a consistent naming convention across every link:
utm_source=instagram,utm_medium=social,utm_campaign=spring_launch. Inconsistent capitalization or naming (igone week,instagramthe next) will silently fragment your data in GA4 and make channel comparisons meaningless. - Treat Shopify or GA4 as your ground truth, not the platform dashboard. Meta and TikTok have every incentive to report generous attribution windows and inflate their own contribution. Reconciling platform-reported ROAS against store-side revenue is the single most important habit in ecommerce measurement.
- Account for pixel and iOS tracking limits. Since Apple’s App Tracking Transparency changes, platforms increasingly rely on modeled conversions to fill gaps in what the pixel can actually see. Modeled data isn’t fake, but it’s an estimate, and it tends to skew optimistic.
- Run incrementality tests when you can. A holdout test (pausing social ads in one region while running them in another) or a geo experiment tells you what sales would have happened anyway, without the spend. This is the only way to separate correlation from actual causal lift, and quarterly is often enough for most mid-size stores.
- Audit your links regularly for tagging errors. Missing UTM parameters, duplicate tags stacked on the same link, or a redirect that strips query strings are the quiet killers of clean attribution data.
Pro Tip: Build a simple spreadsheet or use a URL builder to generate every campaign link before it goes live, rather than tagging links ad hoc. One missing underscore in a UTM parameter can make a week of data unusable.
Build a Dashboard You’ll Actually Look At
A good ecommerce social dashboard has two tiers, and conflating them is why most reports get ignored after the second week.
Tier one: headline metrics, checked daily or weekly. This is revenue by source, ROAS by platform, total sessions from social, and overall conversion rate. These are the numbers that answer “are we making money” at a glance, and they belong on one screen with no scrolling required.
Tier two: diagnostic metrics, checked when something in tier one looks off. This includes CTR by post type, video completion rate, add-to-cart rate, and CPA by campaign. You don’t need to stare at these every day. You need them ready to pull the moment tier one dips and you need to know why.
A practical cadence: check paid campaign performance daily, since ad spend compounds losses quickly if something breaks. Review organic trends weekly, since content performance moves slower. Save incrementality testing and channel strategy reviews for monthly or quarterly, since those require enough data to be statistically meaningful.
One caution on combining sources: platform dashboards and Shopify or GA4 will never match exactly because of different attribution windows and tracking methods. Pick your primary source of truth for revenue reporting, use platform data for diagnostic and creative decisions, and never present both numbers as if they’re measuring the same thing without a note explaining the gap. If you’re running a Shopify store, a dedicated social strategy built around your storefront makes this reconciliation considerably less painful, since the tracking setup is designed around one ground truth from the start.
Setting Realistic Targets With 2026 Benchmarks
Prioritize in this order: revenue KPIs first, funnel diagnostics second, content or vanity metrics third. If you only have time to check one number a week, it should be revenue by source. If you have time for three, add conversion rate and CTR.
A statistic worth anchoring your targets to: TikTok Shop converts at roughly 3.8%, Instagram Shopping at about 2.1%, and Pinterest Product Rich Pins around 1.9% across mid-market DTC brands. Meanwhile, median engagement rates for ecommerce accounts on Instagram sit near 1.9%, with median post interactions and impressions at moderate levels for typical ecommerce brands on Instagram.
How you prioritize should shift based on your product. A low-AOV impulse brand selling $20 accessories should weight TikTok conversion and CTR heavily, since the funnel from view to purchase is short. A higher-AOV considered-purchase brand selling $300 furniture should weight Pinterest saves and Instagram profile visits more, since those buyers research longer before converting.
Follower growth and raw likes still matter, just not for direct response. They matter for brand building, for social proof on your product pages, and for widening the pool of people who’ll eventually see a conversion-focused post. Treat them as a slower, secondary goal, never as the headline metric in a revenue report.
Reading Your Metrics Against the Funnel, Not in Isolation
A metric only means something in context.
Map each metric to a specific funnel stage: awareness (reach, impressions), interest (engagement rate, saves), consideration (CTR, profile visits), intent (add-to-cart, initiate-checkout), and purchase (conversion rate, attributed revenue). When a number moves, the first question isn’t “is this good or bad,” it’s “which stage does this belong to, and what happened one stage before it.”
This is where most store owners misread their own data. A dip in conversion rate often gets blamed on the ad creative when the real cause sits upstream, a broken checkout flow, a shipping cost surprise, a slow page load. Conversely, a strong CTR with weak downstream numbers usually means the content is doing its job and the site experience isn’t.
Reading metrics funnel-stage by funnel-stage also stops you from overreacting to noise. A single viral post that spikes reach but doesn’t move revenue isn’t a failure of measurement, it’s a sign that awareness and purchase intent are different audiences, and bridging them takes a specific offer or retargeting sequence, not just more reach.
What Social Metrics Reveal About Repeat Customers
The metrics that predict a first sale aren’t always the ones that predict a second one. This is where a lot of ecommerce reporting stops too early.
Fulfillment experience is a good example. Orders placed through native platform checkout with fast, integrated fulfillment show notably higher repeat purchase behavior than orders where the merchant handles shipping independently, based on early 2026 TikTok merchant data referenced earlier. That’s a customer lifetime value signal hiding inside what looks like a pure conversion metric.
Engagement after purchase matters too, though it rarely shows up on a standard dashboard. Customers who comment on your posts, tag you in their own content, or follow your account after buying tend to have higher repeat purchase rates than one-time buyers who never engage again. UGC-style content from real customers doesn’t just drive better click-through rates and ROAS on new campaigns; it’s also a leading indicator that a customer is emotionally invested enough to come back.
The practical move is to segment your CLV analysis by acquisition channel and engagement level, not just by first purchase value. A customer acquired through a saved Pinterest pin who later follows your account is a different long-term bet than one who clicked a paid TikTok ad and never interacted again. Track that split, even informally, and your retention marketing budget will go a lot further.
Connecting Social Data to Your Broader Analytics Stack
Social metrics only earn their keep when they sit inside your larger ecommerce analytics setup, not in a separate silo you check once a week out of habit.
The practical integration point is usually GA4 or your store platform’s native analytics, both of which can ingest UTM-tagged sessions and tie them to actual purchase events. From there, revenue by source, customer acquisition cost by channel, and repeat purchase rate by channel all become queries you can run rather than numbers you have to manually piece together from five different platform dashboards.
The mistake to avoid is double-counting. If a customer clicks an Instagram ad, doesn’t buy, then returns two days later through a Google search and completes the purchase, both channels might claim credit depending on your attribution model. Decide upfront whether you’re using last-touch, first-touch, or a multi-touch model, and apply it consistently, or your channel-level ROAS comparisons will quietly lie to you.
Integration also means your social content calendar should be informed by what your analytics stack already knows: which products have the highest margin, which pages have the highest add-to-cart-to-purchase ratio, which customer segments have the best repeat rate. Feeding that back into what you post, rather than treating content and analytics as separate departments, is what actually closes the loop between measurement and revenue.
The Data Quality Problems That Quietly Wreck Your Reports
Most bad social media reporting isn’t caused by bad strategy. It’s caused by bad data feeding a good strategy the wrong signals.
The most common issue is inconsistent UTM tagging, where the same channel gets labeled three different ways across a quarter and your analytics platform treats them as three separate sources. Close behind that is attribution window mismatch: a platform crediting a sale that happened 28 days after a click, while your store analytics only counts a 7-day window, will never agree, and neither number is wrong, they’re just measuring different things.
Bot traffic and click farms inflate impression and click counts on paid campaigns more often than most store owners realize, quietly dragging down your real conversion rate without an obvious explanation. Duplicate tracking, a Meta pixel and a GA4 tag both firing on the same page, can double-count conversions and make your ROAS look better than it is. And platform self-reporting bias is structural: every platform has an incentive to claim credit for a sale, which is exactly why store-side ground truth data matters so much more than any single platform’s dashboard.
The fix isn’t more tools. It’s a monthly audit habit: check your UTM naming, compare attribution windows across platforms, and spot-check a sample of “converted” sessions against actual order records in Shopify.
What Automation Actually Fixes in Your Measurement Setup
Most measurement problems in social commerce trace back to inconsistency, not ignorance. Store owners know they should tag links consistently and post on a schedule. They just don’t have eight spare hours a week to do it by hand, so tagging slips, posting gets sporadic, and the data underneath every report gets noisier than it needs to be.
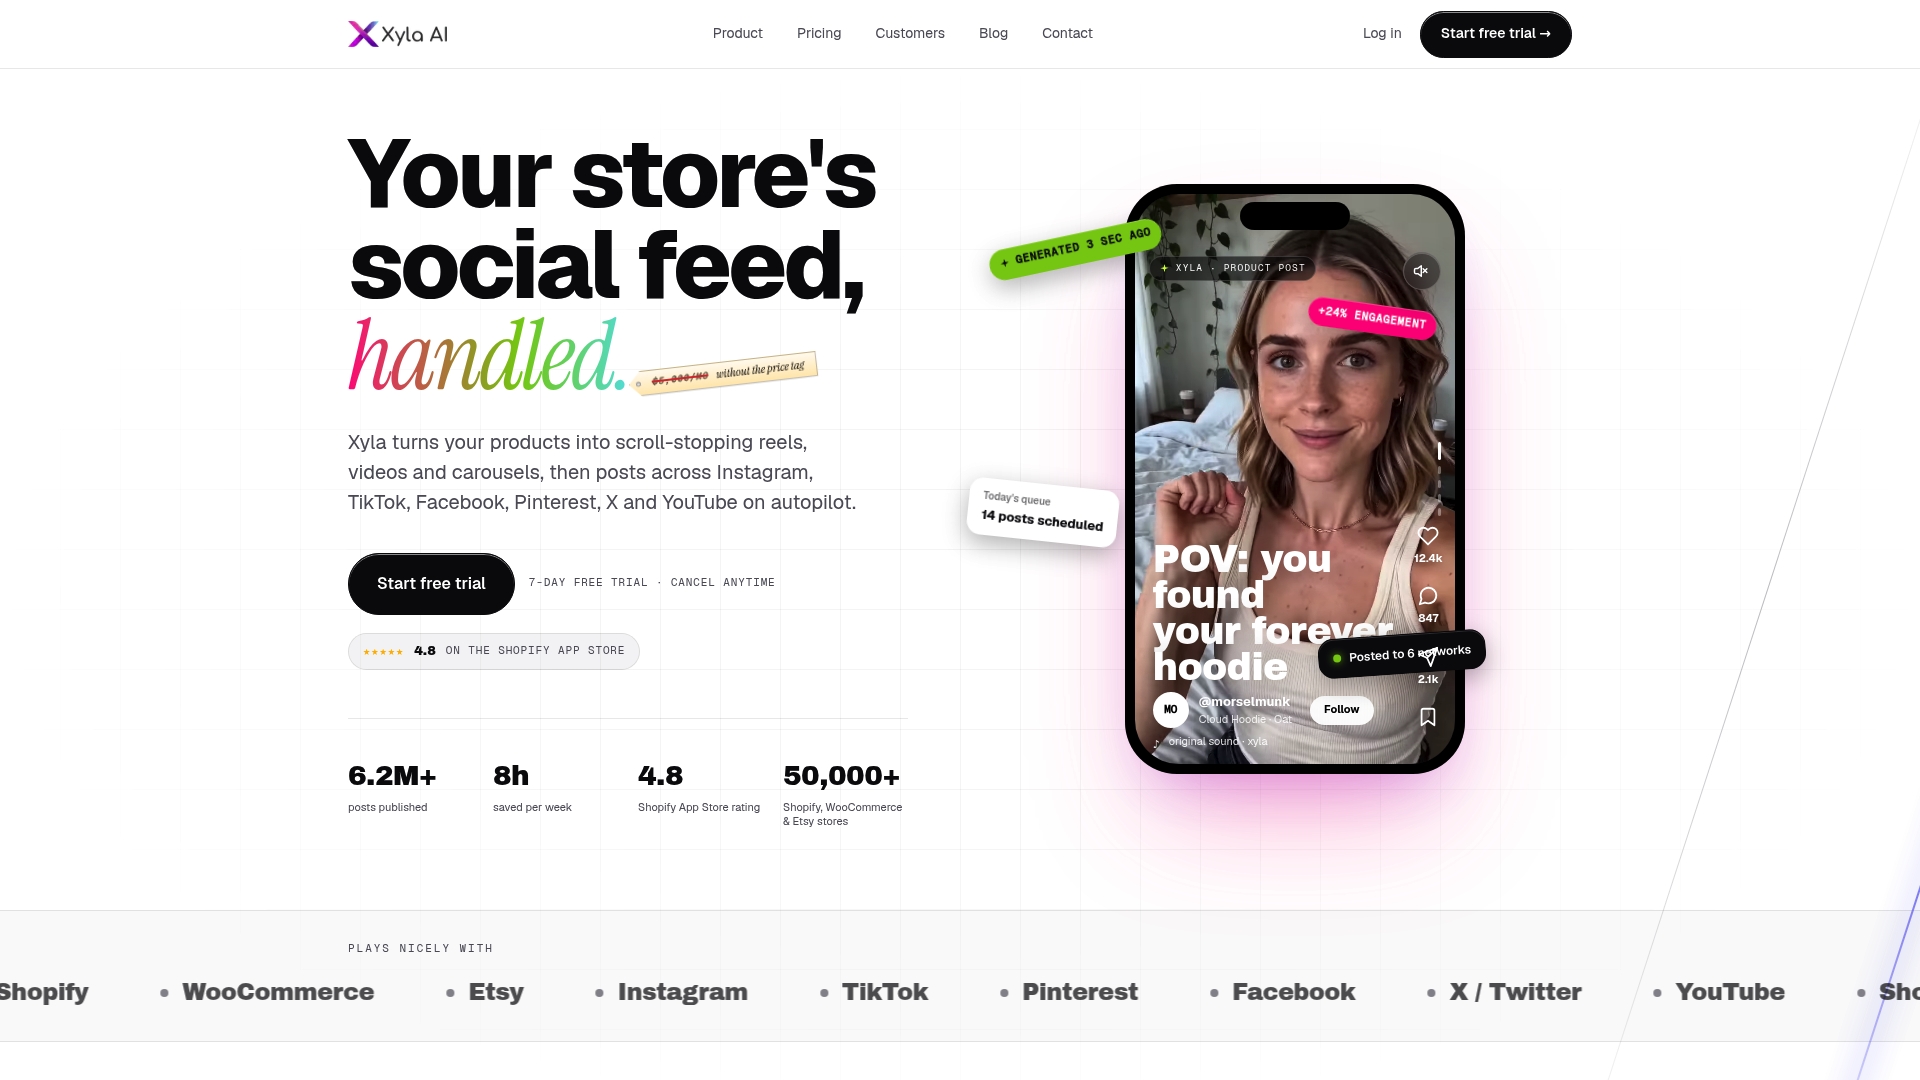
This is the practical case for automating content creation and scheduling rather than treating it as a nice-to-have. When product listings feed directly into generated reels, carousels, and video content that gets scheduled with consistent tracking metadata attached automatically, the manual tagging errors that quietly corrupt attribution data mostly disappear. Xyla AI was built around exactly this problem for Shopify, WooCommerce, and Etsy merchants: turning existing product photos into platform-ready content and publishing it on a schedule without someone manually building each post and link.
The time saved, roughly eight hours a week for most store owners, isn’t really the point. What matters is where that time goes: toward reviewing which content actually converts, running the incrementality tests most stores never get around to, and refining creative based on what the data says rather than what feels right. Automation doesn’t replace measurement. It’s what makes consistent measurement possible in the first place.
— Toby
Automate the Content, Keep the Data Clean
If you’re running a Shopify, WooCommerce, or Etsy store and you’re the one posting content between everything else on your plate, Xyla AI turns your product listings directly into reels, carousels, and video content, then schedules it across Instagram, TikTok, Facebook, and Pinterest with tracking metadata built in from the start. That means less manual work and cleaner UTM data feeding into the dashboard you just built.
What that looks like in practice:
- Auto-generated visual content from photos you already have, no shoot, no editor
- Consistent scheduling with tracking parameters attached automatically, so your attribution data stays clean without manual tagging
- About eight hours a week back, time that can go toward reviewing performance instead of producing posts
If you’ve been meaning to fix your posting consistency and your tracking setup at the same time, that’s really one problem, not two. Start a free trial and connect your store to see how automated social media marketing handles both.
Sources
The platform conversion benchmarks and content cadence data referenced throughout came from Web Tonic’s 2026 ecommerce social media statistics roundup, which aggregates conversion rates and posting frequency data across mid-market DTC brands.
Engagement and impression benchmarks for calibrating “good” performance came from Emplifi’s Q2 2026 ecommerce benchmarks report, a quarterly industry dataset.
Measurement methodology, including UTM discipline and store-side ground truth practices, drew on The Shop Strategist’s guide to social commerce analytics.
Fulfillment and native checkout data came from Ecommerce Times’ 2026 social commerce strategy analysis. Platform behavior context on algorithmic signals came from Momentum Works’ platform behavior research. For SMB-focused metric frameworks beyond social, Reddog Consulting Group’s digital marketing metrics guide offers a useful complement.
- How to Build a Social Commerce Strategy That Actually Converts in 2026 – Ecommerce Times
- 75+ E-commerce Social Media Marketing Stats (2026) | Web Tonic™
- Worldwide Social Media Benchmarks: Ecommerce Q2 2026 | Emplifi


